


RSI Indicator Kya Hai? Beginners ke liye Complete Guide (Hindi)
Share market me successful trading ke liye sirf news ya tips kaafi nahi hote. Professional traders technical indicators ka use karte hain taaki sahi entry aur exit le sakein.
Unhi popular indicators me se ek hai RSI Indicator.
Agar aap beginner ho aur samajhna chahte ho:
RSI kya hota hai
RSI ka use kaise kare
RSI se buy sell signal kaise mile
RSI ka best setting kya hai
Toh ye article aapke liye complete guide hai.
🔷 RSI Indicator ka Full Form kya hai?
RSI ka full form hai:
> Relative Strength Index
Ye ek popular momentum indicator hai jo batata hai:
> Stock overbought hai ya oversold
RSI indicator ko 1978 me J. Welles Wilder ne develop kiya tha.
🔷 RSI Indicator ka Scale kya hota hai?
RSI ka value hamesha 0 se 100 ke beech hota hai.
RSI Level Meaning
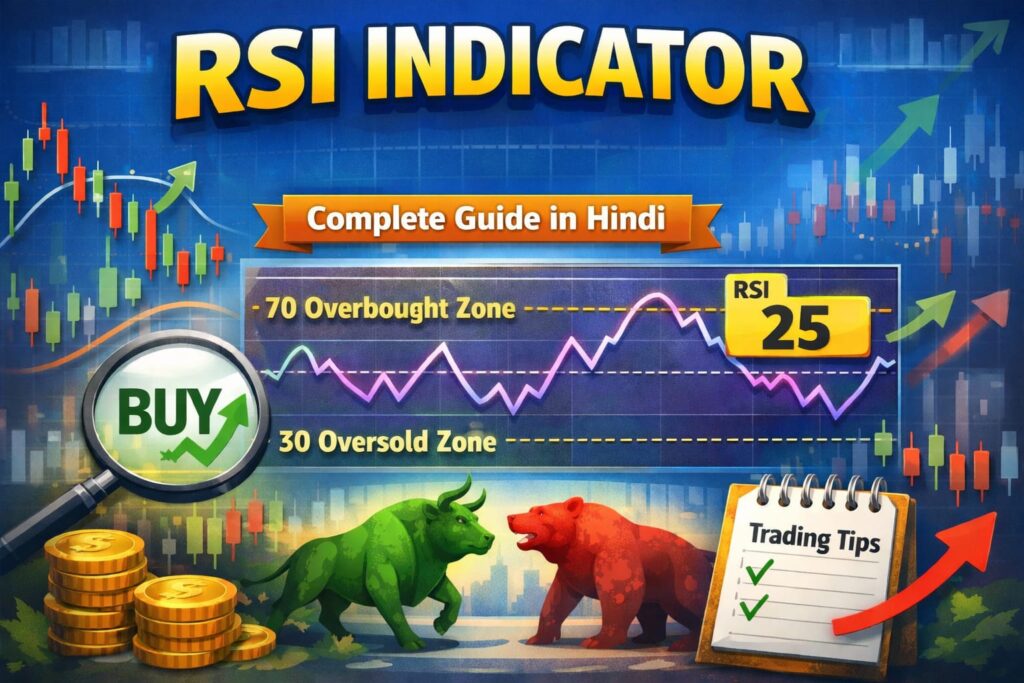
Above 70 Overbought (price gir sakta hai)
Below 30 Oversold (price badh sakta hai)
30–70 Neutral Zone
🔷 RSI Indicator ka Formula (Simple Samjhein)
RSI ka formula complex hota hai, lekin trader ko formula yaad rakhna zaroori nahi.
Simple logic:
Jab price continuously upar jaata hai → RSI badhta hai
Jab price continuously neeche jaata hai → RSI girta hai
Charting platforms jaise:
TradingView
Zerodha Kite
Upstox
Angel One
Automatically RSI calculate karke dikha dete hain.
🔷 RSI Indicator ka Use Kaise Kare?
✅ 1. Overbought aur Oversold Strategy
Ye sabse common RSI strategy hai.
Jab RSI 30 ke neeche jaye → Stock oversold → Buy ka signal
Jab RSI 70 ke upar jaye → Stock overbought → Sell ka signal
Example:
Agar Tata Motors ka RSI 25 ho gaya, toh matlab stock oversold zone me hai → buying opportunity ban sakti hai.
✅ 2. RSI Divergence Strategy (Pro Traders ki favorite)
Divergence ek powerful concept hai.
Bullish Divergence:
Price lower low bana raha ho
RSI higher low bana raha ho
→ Strong buy signal
Bearish Divergence:
Price higher high bana raha ho
RSI lower high bana raha ho
→ Sell signal
Ye strategy swing trading me bahut kaam aati hai.
🔷 Best RSI Setting kya hai?
Default RSI setting hoti hai:
> RSI 14 Period
Ye most accurate aur widely used setting hai.
Lekin trading style ke according change kar sakte hain:
Trading Type RSI Setting
Intraday 7 – 9
Swing Trading 14
Long Term 21 – 28
Beginners ke liye:
> 👉 RSI 14 best hai
🔷 RSI Indicator ka use kis Timeframe me kare?
RSI har timeframe me kaam karta hai:
5 min chart – Intraday
15 min chart – Intraday
1 Hour / 4 Hour – Swing
Daily chart – Positional
Weekly chart – Long term
Zyada reliable signals:
> 1H, 4H aur Daily timeframe par milte hain
🔷 RSI + Moving Average Strategy
Sirf RSI use karna risky ho sakta hai.
Isliye professional traders RSI + Moving Average combine karte hain.
Strategy example:
RSI below 30 → Buy signal
Price 50 EMA ke upar → Confirmation
→ High probability trade
Isse false signals kam ho jaate hain.
🔷 RSI Indicator ke Advantages
✔ Simple aur beginner friendly
✔ Overbought / Oversold clearly dikhata hai
✔ Trend reversal pakadne me madad
✔ Intraday aur long term dono me useful
✔ Har platform me available
–
🔷 RSI Indicator ke Disadvantages
❌ Sideways market me false signals
❌ Strong trend me RSI 70 ke upar ya 30 ke neeche kaafi time reh sakta hai
❌ Sirf RSI par depend karna loss de sakta hai
👉 Isliye hamesha RSI ko:
Support Resistance
Volume
Trendline
ke saath use karein.
🔷 RSI Indicator Beginners ke liye Best Tips
✔ Hamesha higher timeframe check kare
✔ RSI + Price Action combine kare
✔ Stoploss zaroor lagaye
✔ Overtrading na kare
✔ Backtest karke strategy use kare
🔷 RSI Indicator ka Real Life Example
Example: Stock: IRFC
Timeframe: Daily
RSI: 24
Matlab:
Stock oversold zone me hai
Agar support area ke paas hai
→ Swing trade ka acha opportunity ho sakta hai
Aise setups ko professional traders regularly use karte hain.
🔷 Kya RSI Indicator 100% Accurate hai?
Nahi.
Koi bhi indicator 100% accurate nahi hota.
RSI ek tool hai:
> Decision lene me help karta hai, guarantee nahi deta.
Success ka formula:
> Indicator + Discipline + Risk Management
🔷 Conclusion (Final Verdict)
RSI Indicator beginners ke liye ek powerful aur easy-to-use tool hai.
Agar aap sahi tarike se RSI ka use karte ho, toh:
✔ Better entry milti hai
✔ Loss kam hota hai
✔ Discipline improve hota hai
✔ Trading professional banne lagti hai
Lekin yaad rakhiye:
> RSI ko hamesha dusre tools ke saath combine karke use karein.
🔔 Agar aapko ye article useful laga ho:
Toh aise aur articles ke liye follow karein.
Yahan aapko milti hai:
Stock Market Education
Technical Analysis Guides
Long Term Investing Ideas
IPO Reviews
Mutual Fund Knowledge
RSI indicator kya hota hai aur iska use kya hai?
RSI, yaani Relative Strength Index, ek momentum indicator hai jo batata hai ki koi share overbought hai ya oversold, jisse traders entry aur exit decision le sakte hain.
RSI ke scale kya hai aur iska kya matlab hota hai?
RSI ka value hamesha 0 se 100 ke beech hota hai, jahan 70 se upar hona overbought aur 30 se neeche hona oversold dikhata hai, jabki 30-70 ke beech neutral zone hota hai.
RSI indicator ko use karne ke best tarike kya hain?
RSI ka use overbought aur oversold levels par buy ya sell signals ke liye kiya jata hai, jaise RSI 30 ke neeche hone par buy aur 70 ke upar hone par sell signal milta hai, saath hi divergence strategies bhi effective hain.
RSI indicator ke liye best settings kya hain?
Default setting 14 periods ki RSI bahut hi popular hai, lekin trading style ke hisaab se ise 7-9 (intraday), 14 (swing trading) ya 21-28 (long term) par bhi set kiya ja sakta hai, beginners ke liye 14 hi most suitable hai.
RSI indicator kis timeframe par use karna chahiye?
RSI indicator har timeframe par kaam karta hai, jaise 5 min aur 15 min intraday ke liye, 1 hour ya 4 hour swing trading ke liye, daily aur weekly long term ke liye, aur zyada reliable signals in selected timeframes par milte hain.